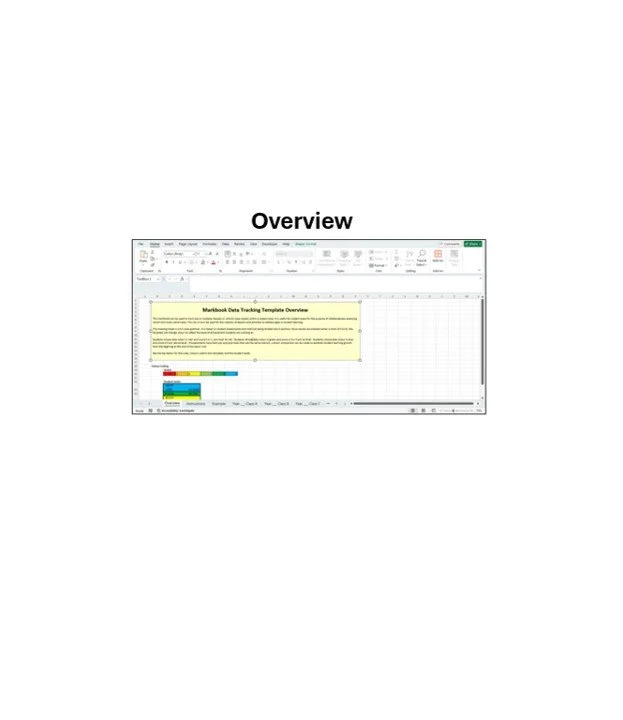


This colour-coded markbook can be used to track one or multiple classes or cohorts (year levels) within a subject area. It is useful for subject areas for the purpose of collaboratively analysing cohort and multi-cohort data. This can in turn be used for the creation of lessons and activities to address gaps in student learning.
This tracking sheet is a 0-5 scale Guttman. It is based on student assessments and matrices being divided into 6 sections. Once results are entered (enter a mark of 0 to 6), the template will change colour to reflect the level of achievement students are working at.
Students whose data colour is 'red' and score 0 or 1, are most 'at risk'. Students whose data colour is green and score a 3 or 4 are 'at level'. Students whose data colour is blue and score a 5 are 'above level'. If assessments have both pre and post tests that use the same matrice, a direct comparison can be made to establish student learning growth from the beginning to the end of the topic/ unit.
Preview the excel spreadsheet images to see what is available.
Mark Book Templates can be purchased as a bundle as well as individually.
The three excel markbook templates include:
Cohort Work Submissions template
Guttman Markbook template
Markbook data tracking template_class, subject, or cohort